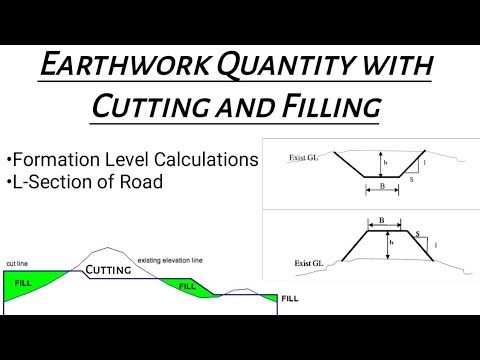
This can be a very complicated process since the amount that the elevation of the soil surface changes can vary considerably and irregularly across the site. The first surface is typically the existing site topography, while the second shows the post-construction site grades. Post construction grades can result from excavation of existing soil, by the placement of additional soil, or by some combination of the two. The volumes required to place soil are typically designated as positive volume while those volumes resulting from excavation are treated as negative volumes. The resultant numbers can be added together to get a cut-to-fill balance for the site.
A well-designed site will result in a balanced cut to fill with the net volume of the two equaling zero. Depending on the nature of the site and its proposed earthwork, there are several options available for accurately estimating the resulting earthwork volumes. The grid method of calculation involves drawing a grid onto the plan for the earthwork project. For each node of the grid, determine the existing and proposed ground level and calculate the cut or fill required.

Once the cut or fill depth is calculated, multiply the value by the area of the grid cell. Do this for each square of the grid, then add the volumes together to determine the total cut and fill volumes for the project. The cross-section method of calculation is a common method used with the 2-dimensional method of mapping.
With this method, cross-sections of the existing and proposed land levels are measured at regular intervals across the site. The cut and fill area is determined for each cross-section, then adjacent cross-sections are compared and the averages of their cut and fill areas are multiplied by the distance between them. This is done for each adjacent pair of sections, then the total volumes are added together to create the complete cut and fill volumes for the project. The slices are aligned perpendicular to a baseline running the full length of the earthwork area.

This is usually the site's longest dimension to increase accuracy, but can also be aligned along a property or tract line, utility easement, right of way, roadway centerline, etc. The interval between the parallel slices can vary depending on the size of the site and the designed accuracy of the calculation. The volume of a massive 1,000-acre site development could be calculated with reasonable accuracy with intervals of 100 to 200 feet. A smaller square building lot of fewer than 10 acres would not achieve reasonable accuracy with such a large interval as it would only utilize six slices.

In general, the smaller the site, the smaller the required interval between slices. The Grid Method.The Grid Method is normally used to estimate volumes excavated from borrow pits . Like the Depth Area Method, the Grid Method utilizes thickness measurements over a given area. Each grid point is treated as the center of a square whose sides are equal to that of the grid interval .

The surface slope within the grid square itself is accounted for and approximated by assigning surveyed or proposed elevations to each of the square's corner points. The square is treated as a column that goes directly down vertically through the proposed soil excavation where the four corners align with matching corners located on the proposed surface. Measurements can then be taken to determine the depth of cut or fill at each corner . A system was developed that applies geographical information system techniques for the manipulation of spatial data in the planning of forest road networks.

The system uses shortest path algorithms for analysing terrain transportation, road transportation and road construction in a given planning area. A greedy-heuristic algorithm was developed to automate the locating of roads. Using the alternative locations of a forest road network, the system calculates many values which are useful in carrying out sensitivity analyses. The system is applicable as an aid in the selection of forest road standards. Bounded road catchment area and limited road extending reach were used in road locating by the greedy-heuristic algorithm to achieve better road locating results.

A local network routing model was developed for improving the capacity of the system. Measurements in the study area was conducted between May and December in 2008. The Standard, the total length and average slope of reviewed forest road, was the B-type, 5 +200 km and 5%, respectively. Measurements were carried out in the excavation slope of road, 10 m away from the road axis and parallel to the road by Geometrics seismic Smartseis 12 models. As a result of the investigation, it has been identified that examined forest road has a layered structure.

Layers are named by the way deep into the ground as Layer 1, Layer 2 and Layer 3. Rock types of layers are very weathered, weathered rocks and rock solid, respectively. As a result of the study, it was examined that it was not necessary risks such as blast, liquefaction, residence, migration, and swelling in the forest road route. The Triangulated Irregular Network and Digital Terrain Model Methods.The Triangulated Irregular Network method utilizes files created by AutoCAD (".tin" files) on topographic surfaces to determine volumes. This, in turn, allows for the creation of highly accurate Digital Terrain Models. Given the huge number of calculations required, this is a process that can only be done on a computer.

The DTMs allow for direct calculation between a surface and a fixed elevation or two such surfaces. DTMs can also be generated for different soil strata in an excavation, allowing for direct calculation of volumes for each soil type. Formulas and methods for determining the volumes and areas of regular shapes and surfaces go back at least as far as ancient Greece. Pythagoras and other mathematicians determined those formulas that are still used to calculate the volumes of spheres and pyramids, as well as the areas of curve conic sections.

But what was a matter of mystic philosophy to the Greeks is a matter of financial life or death for earthwork contractors. Since there is an inherent error in any estimating earthwork calculation, the contractor must properly manage the resultant unknowns to ensure the success of the project. Aerial topography, as distinct from ground surveys, has its own sources of potential error.

The result is relief displacement where buildings and other large objects may not be accurately seen on the topographic map. And even the most accurate aerial topographic map is accurate to only one-half of the map's smallest contour interval. So, a map showing 1-foot elevation contour intervals would have elevation accuracy of only plus or minus 0.5 feet. The cut and fill process is an extremely useful process for excavation in residential, commercial and roadwork projects.

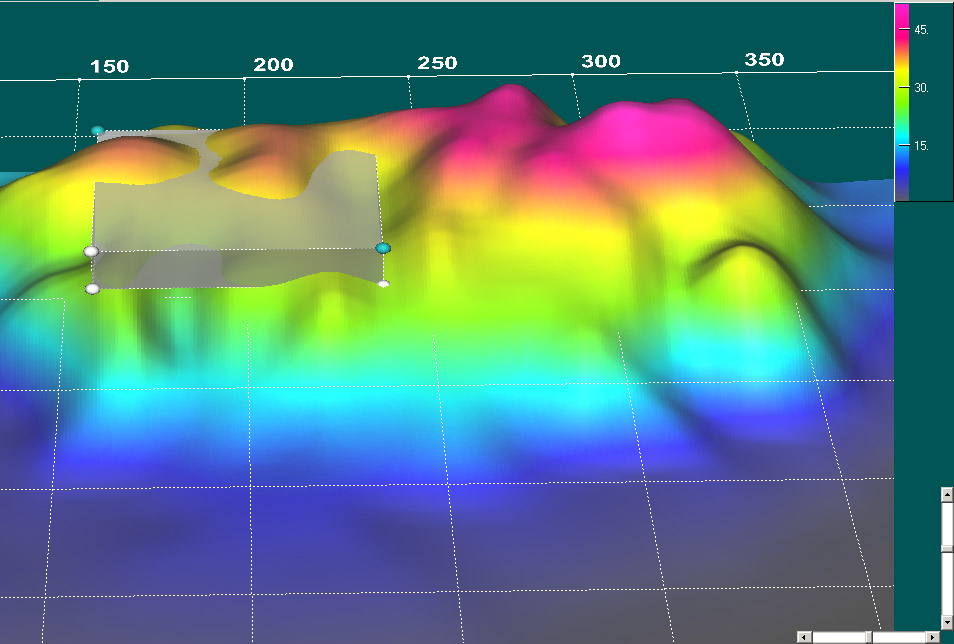
However, while cut and fill makes use of existing terrain, it requires detailed planning to be as effective as possible. To accomplish this goal, project planners need detailed cut and fill maps — that means they need survey equipment to get terrain information and software to process and visualize data in a meaningful way. The triangular prism method starts by triangulating the existing terrain to create a continuous surface of connected triangles. Once both surfaces are complete, the triangulations are merged to create a third triangulation. Once merged, the cut and fill is calculated by taking the volumes of the generated triangles and adding them together. Because of the excellent representation of both the existing and desired terrains, this method presents an excellent representation of volumes for cut and fill projects.

The cross-section method of calculation is considerably more time-consuming than automatic methods of calculating volume, and the accuracy of the method depends on the distance set between sections. Closer sections result in greater accuracy but take longer to calculate, while further sections are less accurate but take less time to calculate. Validating benchmarks can either require a regional survey to link each benchmark to known points, or a thorough records search of previous property surveys and benchmark certifications. This records search is vital and should actually be the first step performed in any site survey. The locations and elevations of each wellhead should also be recorded, allowing for further checking of survey accuracy. Other site surveys may delineate special areas of impact such as karst topography or protected wetlands.
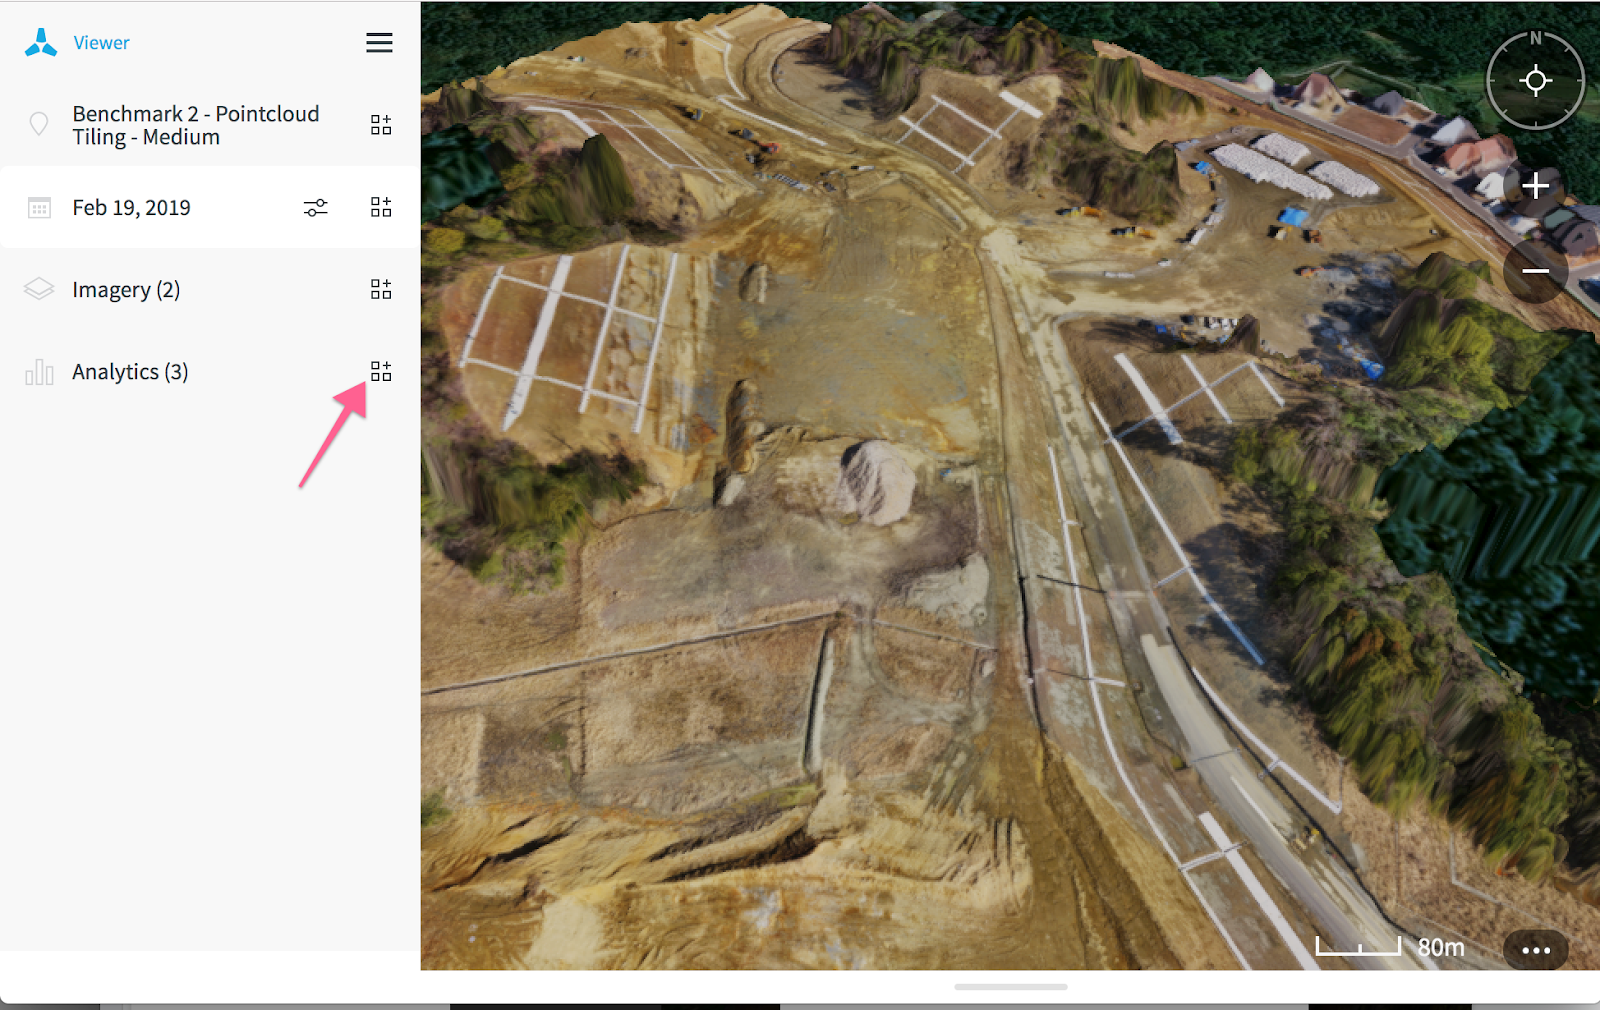
You can select whether to measure cut-and-fill volumes within some specified distance of the selected line or within the specified area. Whichever option you choose, the heights will be interpolated between line vertices to get a smoothly varying cut height. If measuring within an area, there is also an option to perform multiple cut-and-fill calculations between a range of cut height values. If you choose this option the results will be displayed in a table at the end of the operation so you can see the results of each calculation. Volume calculation is a procedure in which the elevation of a landform surface is modified by the removal or addition of surface material. The Volume Calculation map tool summarizes the areas and volumes of change from a cut-and-fill operation.

Using the digital surface model product and an area of interest with a given base type, the tool identifies regions of surface material removal and addition. If you're using an earthwork software, you may not need to use one of the manual methods above. It should be noted that these software systems are faster but not inherently more accurate — for example, some software calculations are based on high-density versions of the cross-section or grid methods.

However, automated systems often use more sophisticated calculation methods, such as the triangular prism method. In cut and fill excavation, the ultimate goal is to conserve mass as much as possible. Both of these outcomes result in extra material, labor and equipment costs. To avoid bringing in or removing excess mass, cut and fill processes are planned in a way to keep cut mass and fill mass approximately the same.

The goal of cut and fill is ultimately to conserve energy and maximize the use of existing materials to avoid bringing in or shipping out dirt mass. While common, it can be an exhaustive process — moving earth takes a great deal of labor, and mistakes can lead to costly rework. To avoid such problems, project planners use detailed and intelligent cut and fill maps, providing exhaustive plans to help guide excavation teams to the most efficient use of mass and labor. The largest use case for drone surveying on construction sites is calculating volumes. For those in the industry who rely on accurate cut and fill calculations, this won't be surprising.
After viewing the reported volumes, you have the option to save a new feature with the measurement values. The net volume is the positive, or cut, volume minus the negative, or fill, volume. To visualize net volume, consider a construction site where the topography must be graded to a flat surface prior to the beginning of construction.

The upper surface represents the current topography, and the lower surface represents the final graded site elevations. In some places, cut must be made into the current topography to remove earth to the level of the final site. In other areas, earth may be needed to fill in areas where the current topography is below the elevation of the final site. If the volume is positive, earth needs to be removed from the site to achieve the final level. If the volume is negative, earth needs to be hauled into the site to achieve the final planned grade for the site. A number of software products are available for generating cut and fill maps, and many of them automatically calculate and optimize cut and fill projects.
However, if you're using more manual methods, a manual calculation may be required. A variety of calculation methods are used to calculate cut and fill values, and some of these methods are detailed below. Choosing to use a 2-dimensional model over a 3-dimensional one should depend on the level of accuracy required for the project. Smaller-scale projects with limited cut and fill needs may not require more than 2-dimensional diagrams. Larger and more expensive projects, however, will usually require the accuracy provided by a 3-dimensional diagram.
![]()
Beyond this difference, the ability to use one type of diagram over another depends on access to the site and equipment availability. If you want to determine the remaining earthwork or compare to a design, you need to import the design surface into Virtual Surveyor. Create a new Terrain State and drop the design CAD file in the project view. Make sure to select the design surface and click on the Modify terrain button available in SELECTION - TOOLS for Surface. Switch to the current terrain state and select the design terrain state as reference before launching the Volume Difference calculation. You can then measure the dirt to be moved using the same process as the quick steps, but comparing to the design surface.

Once the bid is won, the contractor moves into the operational phase. Traditionally, more detailed models are created at this stage, and the estimating model is usually discarded. A single constructible model can mobilize the most complex projects rapidly, linking to Trimble or third-party and OEM systems. Bringing estimating teams and operational execution teams closer together using common tools is extremely important to be competitive on construction bids. When it comes to construction, sites can vary widely in their plans and look. To illustrate the benefits of drone surveying in calculating cut/fill quantities, let's look at a housing development site as it covers many aspects of different construction projects.

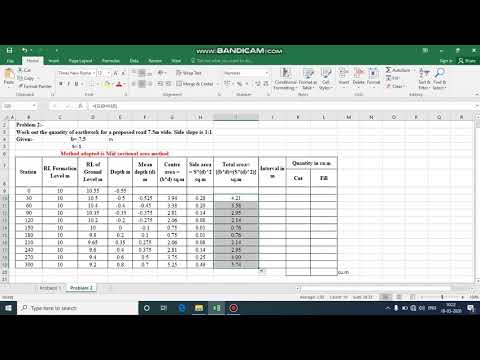
How To Calculate Cut And Fill Volume In Excel Like the cross-section method of calculation, the grid method takes time to implement and is significantly more time-consuming than any automatic systems. Additionally, the accuracy of the grid method depends on the size of the grid cell. Larger cells take less time to calculate but are less accurate, while smaller cells are more accurate but take more time to calculate.
So you've determined that you'll need to use cut and fill excavation in your project, and you have an idea of what method you'll be using. How do you calculate cut and fill area so that you can plan out the labor and calculate your project costs? The calculation method depends largely on the method you'll be using in your project. From the complete map, cut and fill can be planned around existing topographical features. Commonly, a map with these features may be used as a base, with the final project laid over it to determine areas of potential cut and fill.

Once initial plans are made, cut and fill plans are added based on the topographical features. But even before the occurrence of errors in field measurement, the very basis of the survey may be faulty. These are the previously established benchmarks that anchor the entire site survey to local topographic data and the real world itself. All benchmarks located near the site need to be checked prior to a survey for accuracy and validity. Ideally, three each "third order" should serve as the basis of the ground survey, but at least one such benchmark is a necessity.
If there is no other option, a survey can rely upon a "relative benchmark" such as a building corner or manhole lid. Assigning an arbitrary elevation such as 100 feet to such a point can allow for the measurement of elevations relative to this makeshift benchmark. But this ad hoc approach is inherently less accurate and should never be used for critical site surveys. Having accurate cut/fill maps helps construction teams plan earthwork projects, track material inventories, and monitor progress.

The Cut & Fill Volumes section uses a different calculation technique than the three methods used to define the volume, Extended Trapezoidal Rule, Extended Simpson's Rule, and Extended Simpson's 3/8 Rule. For determining cut and fill volumes, first the lower surface grid values are subtracted from the upper surface grid values. This normalizes the Z values where positive values indicate the upper surface is above the lower surface and negative values indicate the upper surface is below the lower surface. While effective at conserving mass, cut and fill is an expensive process. The cost of this kind of excavation increases as more land is moved and more equipment and labor are needed to do so.

To help maximize the use of earth, equipment and labor, site planners often use what is called a cut and fill map. The approximate volume can be calculated by hand by finding the area of each contour line from the elevation you want the level down to, and adding them together. I get a cubic meter quantity calc of 10,450 with the open contour lines. These details can then be combined into scheduling software, which can convert quantities and haul distances with production rates and assigned resources to create a time-location schedule. Traditional GANTT chart users cannot apply seasonality or environmental constraints reliably.


No comments:
Post a Comment
Note: Only a member of this blog may post a comment.